training
Big Dive
Agile Lab is Technical Partner of Big Dive, an exclusive training program designed to boost the technical skills you need to dive into the Big Data...
How a developer can remotely debug a running Spark Scala/Java application (running on YARN) using IntelliJ IDEA
This article will focus on how a developer can remotely debug a running Spark Scala/Java application (running on YARN) using IntelliJ IDEA, but all the Spark and environment configurations hold also for other IDEs.
To perform remote debugging of a Spark job, we leverage the JDWP agent (Java Debug Wire Protocol) that defines a communication protocol between a debugger and a running JVM. JDWP defines only the format and layout of packets exchanged by the debugger and the target JVM, while the transport protocol can be chosen by the user. Usually, the available transport mechanisms are shared memory (dt_shmem) and socket (dt_socket) but only the latter, which uses a TCP socket connection to communicate, can be used for remote debugging.
So in order to enable remote debugging, we must configure the target JVM with the following Java property in order to make it acting as a JDWP server to which our IDE can connect:
<mark>-agentlib:jdwp=transport=dt_socket,server=y,suspend=y,address=4747<mark></mark></mark>
The property above tells the JVM to load the JDWP agent and wait for a socket connection on the specified port. In particular:
transport=dt_socket tells the agent to use socket as the desired transport mechanism.server=y means that the JVM will act a JDWP server: it will listen for a debugger client to attach to it.suspend=y tells the JVM if it must wait for a debugger connection before executing the main function. If this is set to false (n), the main function will start while listening for the debugger connection anyway.address=4747 specifies the port at which the debug socket will listen on. In the example, the target JVM will listen on port 4747 for incoming client connections.We will leverage the JDWP agent for all the following remote debugging scenarios, so remember that you can always adjust the configurations listed above to fit your use case.
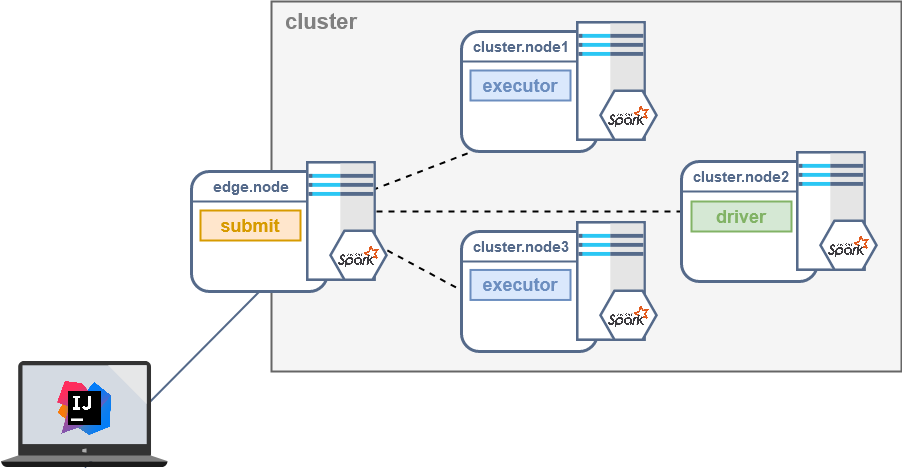
Before delving into the debug of your application, here’s a quick recap of how a Spark job executes on a cluster; each Spark job requires:
* a process called driver that performs all the standard Java code
* one or more executor processes that will perform all the code defined inside the transformations and actions of the RDDs/Datasets.
This means that in a realistic scenario we will have different JVMs running at the same time (often on different nodes): one for the driver and one for each executor.

Spark allows the developer to run a job in different modes depending on the requirement of the desired use case. In particular, we will focus on two configurations of the spark-submit command: deploy-mode and master.
Those two configurations allow a developer to decide how the Spark application will be deployed and run:
Even in one of the allowed value for master is local, which allows running the application on the local machine specifying how many threads should be used, we will not explore it: there is no need for remote debugging if the Spark application runs with master local since everything runs on the same local JVM.
This article will focus only on Spark applications launched with a spark-submit run against a YARN cluster (master yarn configuration), but the same considerations will hold also for other resource managers.
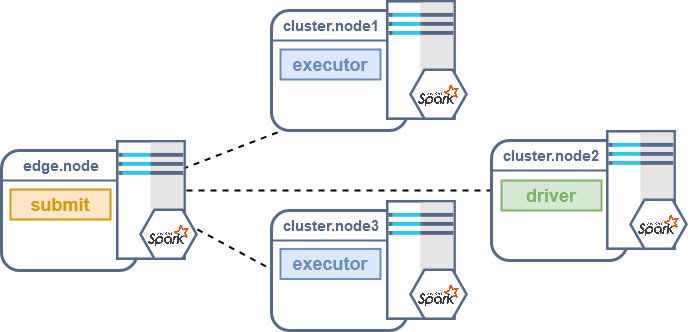
When the spark-submit command is invoked with client deploy-mode, Spark will spawn the driver in the client process that performed the submit command. Executors will spawn into nodes of the cluster depending on the resources associated with them.

If you are performing the spark-submit command from an edge node of your cluster, you can debug the driver code by simply passing the JDWP agent configuration as a driver extra Java option:
spark-submit

    --class org.example.MyJob

    --master yarn

    --deploy-mode client

    --conf "spark.driver.extraJavaOptions=-agentlib:jdwp=transport=dt_socket,server=y,suspend=n,address=4747"

    myJob.jar
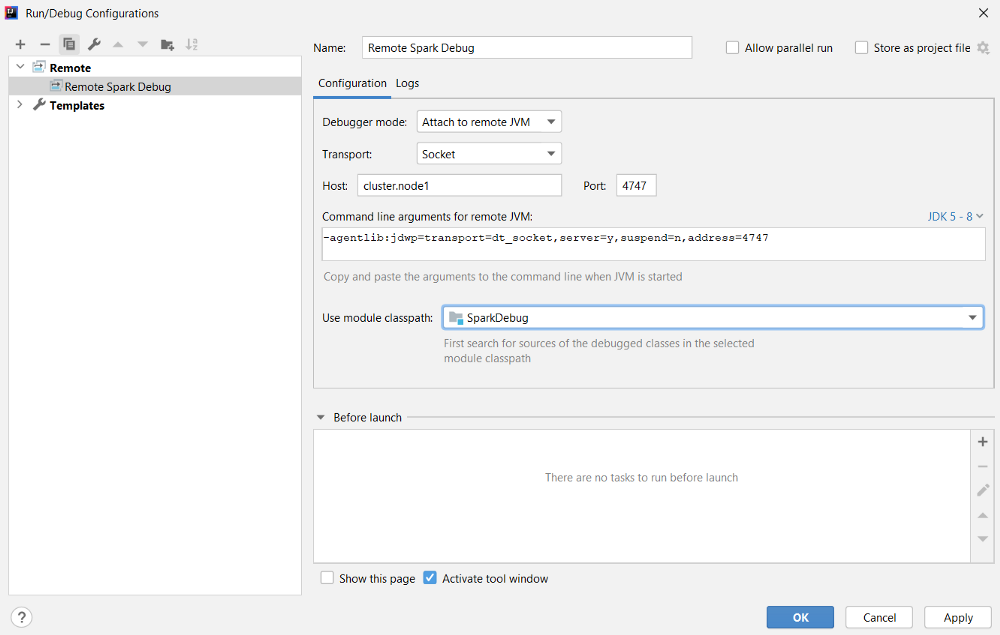
The command above will start the Spark job with the driver running on the edge node and listening on port 4747 (this value is arbitrary, you can choose any available port number here). Now we can setup our IDE to start a remote debug towards the edge node IP and port 4747:

We can start debugging our code with the configuration just defined by clicking on the debug icon:

Code execution will stop at each breakpoint we define in our code; remember that since we are debugging the driver we can set up breakpoints anywhere in our code except for the code defined inside RDDs/Datasets, that will be performed by the executors.
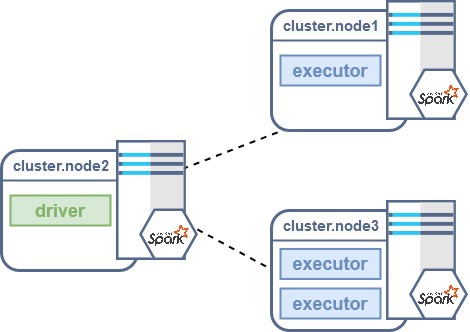
To debug the executor code we can focus on how a Spark job behaves in cluster deploy-mode: the driver is spawned into one of the cluster nodes as well as the executors. So in this configuration connecting to the driver or one of the executors will require us to check where the processes are actually running.
If we need to debug the driver we can pass the same configurations presented above for the client mode, while if we need to debug one of the executors we should pass the agent properties in the executor options instead of the driver options:
spark-submit

    --class org.example.MyJob

    --master yarn

    --deploy-mode client

    --conf "spark.executor.extraJavaOptions=-agentlib:jdwp=transport=dt_socket,server=y,suspend=n,address=4747"

    myJob.jar
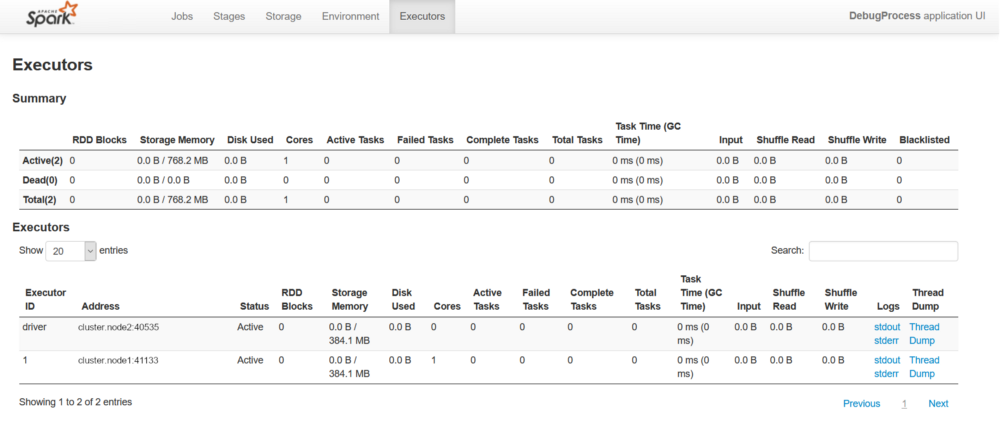
As discussed, in cluster mode if we want to debug the driver or one of the executors we first need to find out where the actual process is running. To do so we can leverage the Spark UI: whenever we start the job we can access its Spark UI using the link printed by the spark-submit command.
Then we can access the Executors section of the Spark UI, where all the running processes associated to our job are listed. From here we can see the driver node and all the nodes where executors are running, so we can find the executor IP and use it in our IDE debug configuration.
At this point, we need to check the Spark UI to find out the IP addresses of the desired nodes. Since we defined the port in the agent configuration, we should keep the same debug port, changing only the IP address.
To simplify the debugging mechanism it is advised to start your Spark job with only one executor: debugging a Spark job with multiple executors dramatically increases its complexity. For example, if two executors are spawned on the same node, they will have the same IP address and debug port, so it could lead to inconsistencies. For debug purposes, you could scale it down to only one executor.
spark-submit

    --class org.example.MyJob

    --master yarn

    --deploy-mode client

    --num-executors 1

    --conf "spark.executor.extraJavaOptions=-agentlib:jdwp=transport=dt_socket,server=y,suspend=n,address=4747"

    myJob.jar
If we decide to debug one of the executors, code execution will stop at each breakpoint we define inside RDDs/Datasets transformations and actions; remember that since we are debugging the executor, all breakpoints set up outside RDDs/Datasets will not be reached since that code will be performed only by the driver process.
In a real scenario, the Spark job will run inside a cluster which is not accessible from the outside world: you can only access a cluster edge node, but you are not able to access directly the nodes where the driver and executors processes will run. The edge node can access the nodes since it is co-located in the cluster.
In this situation we need to take advantage of a mechanism called port forwarding: we can forward the port of our target node to a port of the edge node. In this way, we can use our edge node (for which we have access) as a proxy for the desired target node (for which we don’t).
A very common way to perform the port forwarding is to use ssh:
<mark>ssh -L 4848:target.node:4747 user@edge.node<mark></mark></mark>
The command above, run from your local machine, will connect to the edge node (edge.node) with the specified username (user). Obviously you must provide your identity to the remote machine, the edge node, using one of several methods depending on the protocol version used. The -L specifies that the given port on the local host (4848) has to be forwarded to the given host (target.node) and port (4747) on the remote side.
In summary, in order to perform remote debugging of your code for a Spark job running in a cluster like the one described above you will need to:

If you made it this far, you may be interested in other Spark-related articles that you can find on our blog.
Stay tuned because other Spark articles are coming!
Senior Big Data Engineer. He started his career as a full stack engineer and then moved to big data. Lately he has been focusing on the creation of Witboost, as project leader and architect, managing highly complex environments, and acting as an experienced technical team leader.
Agile Lab is Technical Partner of Big Dive, an exclusive training program designed to boost the technical skills you need to dive into the Big Data...
A new online event to talk about Recommendation systems. Save the date: 17th February 2021.
A new online event to talk about how to configure a cluster Kubernetes using Ansible. Save the date: 13th January 2021.